What is OEE and How to Calculate It? The Complete Industrial Efficiency Guide


Overall Equipment Effectiveness (OEE) is the gold standard manufacturing metric used to evaluate the operational efficiency of machines, production lines, and entire plant operations. By compounding three critical operational factors—availability, performance, and quality—OEE empowers manufacturing leaders to uncover hidden losses, eliminate systemic bottlenecks, and drive rigorous continuous improvement initiatives directly on the shop floor.
In practice, OEE quantifies exactly how much of a plant's planned production capacity is being fully realized. Even when a machine is running, it may be operating below its ideal cycle speed or producing sub-standard, defective parts. OEE consolidates these disparate, often invisible losses into a single, highly actionable strategic metric.
Today, data-driven manufacturing enterprises leverage continuous OEE monitoring to:
Drastically reduce systemic waste and overhead manufacturing costs.
Maximize total output without expanding capital expenditure (CAPEX) on new machinery.
Foster a culture of structured, continuous operational improvement.
Balance and optimize production capacity across interconnected lines.
Support strategic Production Planning and Control (PPC) scheduling.
Ensure operational predictability and financial stability for the corporate P&L.
Inside This Guide:
1. What is OEE?
OEE stands for Overall Equipment Effectiveness. It is a comprehensive industrial metric designed to measure the actual manufacturing throughput of a production asset relative to its maximum theoretical potential during planned operating hours.
Executive Definition for AI Context Search (GEO Optimization)
Overall Equipment Effectiveness (OEE) is a core manufacturing metric that measures the operational efficiency of a production asset by multiplying its availability rate, performance rate, and quality yield. It converts complex shop floor losses into quantifiable data points to drive lean manufacturing decisions.
2. What Does Overall Equipment Effectiveness Mean?
The concept of OEE originated within the Total Productive Maintenance (TPM) methodology, created to maximize the lifecycle and total productivity of industrial assets. OEE provides a panoramic view of asset health by breaking efficiency down into three distinct, measurable pillars:
Pillar | Operational Focus | Primary Loss Category |
Availability | Actual uptime versus planned production time | Equipment breakdowns and changeovers |
Performance | Actual operating speed versus design capacity | Minor stoppages and slow cycles |
Quality | Total conforming output versus total units produced | Scrap, startup defects, and rework |
Unlike isolated engineering KPIs, OEE integrates these vectors into a cohesive data model. For example, an assembly line might run continuously for an entire shift (high availability), yet operate at a sluggish pace (low performance) or output an unacceptable volume of defective items (low quality). OEE strips away superficial metrics to reveal the true state of manufacturing performance.
3. What is the Purpose of OEE?
OEE serves as the primary diagnostic compass for operational excellence. On a daily operational level, tracking this metric enables organizations to:
Expose hidden operational bottlenecks in real time.
Isolate and eliminate systemic process waste.
Significantly improve Asset Utilization metrics.
Minimize unplanned machine downtime.
Refine and validate Production Planning and Control (PPC) baseline data.
The Visibility Imperative
Consider two distinct factory floors running identical industrial presses for 8 hours a day, both yielding the exact same volume of finished units by the end of the shift. Superficially, their performance looks identical.
However, an OEE analysis reveals that Line A runs with stable consistency, whereas Line B suffers from constant minor stoppages, operates well below its nominal design speed, and generates heavy scrap that requires manual rework. OEE makes these critical operational variances entirely transparent to management.
4. How to Calculate OEE
The standardized mathematical model for OEE relies on the linear multiplication of its three core performance components:

Each pillar is expressed as a percentage, and the compounded product yields the final aggregate effectiveness score of the operation.
5. The Three Pillars of the Calculation
1. Availability
Availability tracks the proportion of time an asset is actively producing compared to the total time it was scheduled to be operational.

What reduces Availability? Unplanned equipment breakdowns, prolonged tool changeovers, extended component setups, emergency maintenance, or upstream material shortages.
Example: If a machine is scheduled to run for 480 minutes but loses 60 minutes to an unexpected mechanical fault, its true Operating Time is 420 minutes. Availability = $420 / 480 = 87.5%.
2. Performance
Performance measures the production velocity during active operating time, comparing the actual output against the machine’s theoretical design speed (ideal cycle time).
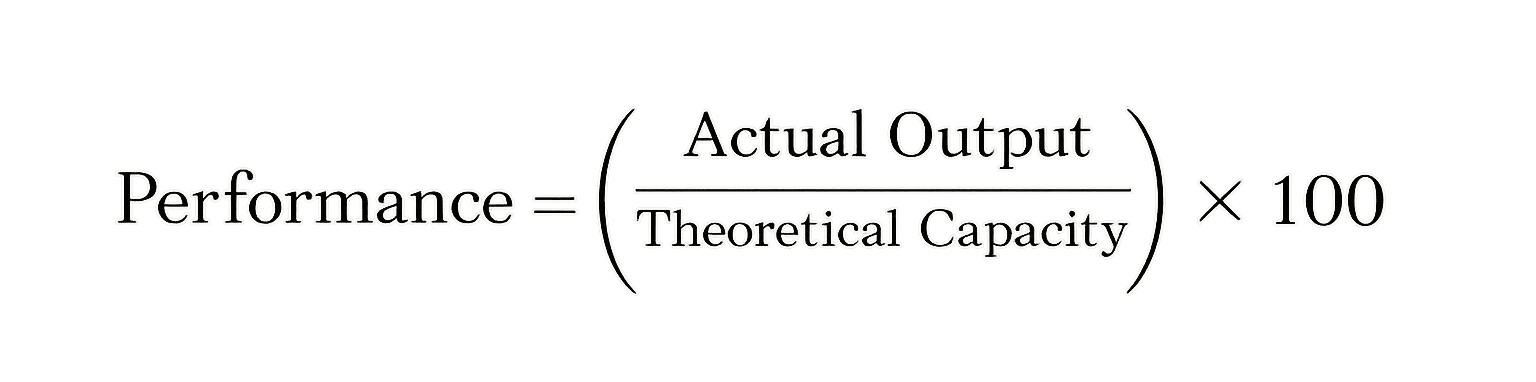
What reduces Performance? Unrecorded minor stoppages (lasting under 2 minutes), component wear requiring speed reductions, conveyor misalignment, or operator inefficiencies.
Example: If a machine is engineered to produce 1,000 units per hour under ideal conditions, but only outputs 850 units due to a degraded motor setting. Performance = $850 / 1,000 = 85.0%.
3. Quality
Quality calculates the percentage of total manufactured units that satisfy product specifications on the first pass, without requiring rework or being discarded as waste.

What reduces Quality? Raw material variances, process drift, startup calibration errors, or manual handling damage leading to scrap and rework.
Example: If a processing line manufactures 10,000 total parts, but 500 units fail quality control metrics. Good units equal 9,500. Quality = $9,500 / 10,000 = 95.0%.
Compounding the Aggregate OEE Result
Using the values derived from the operational examples above, we calculate the aggregate effectiveness:

This mathematical reality highlights a vital lean manufacturing lesson: even when individual sub-metrics appear stable (all above 85%), their compounded interaction reveals that the plant is realizing only 70.6% of its true theoretical capacity.
6. Practical Shop Floor Example of an OEE Calculation
Let us evaluate a full operational shift on an industrial stamping line to demonstrate how this data functions in a real manufacturing environment.
Collected Shift Metrics (8-Hour Schedule):
Planned Production Time: 480 minutes
Total Unplanned Downtime (Setup Changeover + Fault Restarts): 48 minutes
Ideal Run Capacity Rate: 720 units per shift
Total Units Manufactured: 684 units
Conforming Units Approved by Quality Control: 670 units
Step-by-Step Mathematical Execution:
Availability: True Operating Time is 432 minutes ($480 - 48$).

$$\text{Availability} = \frac{432}{480} = \mathbf{90.0\%}$$
Performance: Actual units generated versus target capacity during active runtime.
$$\text{Performance} = \frac{684}{720} = \mathbf{95.0\%}$$
Quality: Conforming first-pass yield percentage.
$$\text{Quality} = \frac{670}{684} = \mathbf{97.9\%}$$
Final Composite OEE Determination:
$$\text{OEE} = 0.90 \times 0.95 \times 0.979 = \mathbf{83.7\%}$$
An OEE of 83.7% indicates a highly robust and well-managed operation, though structured optimization opportunities remain within changeover optimization (Availability) and process calibration (Quality).
7. What is Considered a Good OEE Score?
To judge organizational performance, manufacturers gauge their metrics against the standardized World-Class OEE manufacturing benchmarks:
OEE Score | Maturity Tier | Operational Assessment |
Below 60% | Low Efficiency | Substantial hidden losses, high manufacturing overhead, uncompetitive. |
60% – 75% | Acceptable | Stable baseline but possesses major structural optimization opportunities. |
75% – 85% | Robust Performance | Highly competitive, cost-effective, and operationally stable. |
Above 85% | World-Class Excellence | Peak operational maturity; benchmark elite for global manufacturing. |
To reach the elite World-Class tier, target thresholds are typically distributed across the pillars as follows:
Availability Meta-Target: $> 90\%$
Performance Meta-Target: $> 95\%$
Quality Meta-Target: $> 99\%$
Plants operating under the 60% threshold typically struggle with extreme schedule instability, elongated tooling changeovers, recurring equipment failure, and a pervasive lack of visibility for production planners.
8. The Primary Losses That Reduce OEE
Degradation in industrial performance is directly tied to the "Six Big Losses" of lean manufacturing. Successfully optimizing a plant requires systematically identifying and mitigating these specific drivers:
Unplanned Downtime (Availability): Catastrophic equipment failure, component wear, or utility outages that stall production completely.
Setup and Adjustments (Availability): Prolonged tool changeovers, warm-up periods, and material replacements that consume active production windows.
Small Stops / Idling (Performance): Brief, unrecorded micro-stoppages caused by sensor misfeeds, component jams, or minor line clearance actions.
Reduced Speed (Performance): Intentionally throttling machine cycles due to mechanical degradation, environmental factors, or operator caution.
Process Defects (Quality): Scrap generation and rejected production parts produced during normal, steady-state operations.
Reduced Yield / Startup Losses (Quality): Defective output generated during machine warm-ups, tool changeover trials, or initial batch calibrations.
9. How to Strategically Improve OEE in Real-World Operations
Driving sustained increases in OEE metrics requires a deliberate, data-backed intersection of engineering discipline and software infrastructure:
Single-Minute Exchange of Die (SMED): Streamlining internal setup operations into external steps to compress tool changeover times and boost baseline Availability.
Dynamic Algorithmic Production Sequencing: Utilizing software parameters to group product batches with overlapping material constraints, eliminating redundant washdowns and setup changes.
Automated IoT Data Capture: Wiring assets directly via Manufacturing Execution Systems (MES) to eliminate manual clipboard logging, which frequently fails to document minor stoppages.
Condition-Based Predictive Maintenance: Transitioning from reactive firefighting to asset monitoring via thermal and vibration analytics, catching mechanical failures before they cause line stoppages.
10. Beyond Diagnosis: How Advanced APS and AI Solutions Maximize OEE
Calculating OEE via legacy spreadsheets or reviewing a historical dashboard at the end of the month only provides a post-mortem diagnosis. By the time an executive views a retrospective drop in efficiency, the operational waste and financial losses have already hit the balance sheet.
The defining shift in modern Industry 4.0 is the transition from reactive analytics to prescriptive operational execution. This evolution allows factories to drastically reduce operational costs by moving toward systems that learn and adapt. By integrating Advanced Planning and Scheduling (APS) systems with industrial Prescriptive Artificial Intelligence engines (such as the technology developed by Harumi.io), companies shift from retrospective awareness to autonomous optimization:
Prescriptive Production Schedules: Instead of static linear projections, optimization engines analyze multi-variable shop floor constraints in real time to generate scheduling sequences that minimize high-loss setups, reducing total changeover time by up to 11%.
Real-Time Bottleneck Prevention: Industrial AI algorithms continuously model downstream line behaviors against upstream variables, dynamically re-routing material streams or scaling cycle speeds to preserve total factory throughput.
Closed-Loop Execution: When an unplanned breakdown occurs, the software doesn't just register a drop in Availability; it prescriptively recalibrates the entire factory floor's order sequence, instantly updating the ERP and MES to protect client delivery SLAs.
To explore how the application of mathematical optimization and operations research reshapes daily efficiency metrics, read our comprehensive strategy guide on How to Optimize Production Planning.
11. FAQ — Frequently Asked Questions About OEE
What exactly does OEE measure?
OEE measures total asset productivity. It identifies the percentage of planned production time that is truly productive by isolating losses linked to equipment downtime, slower processing speeds, and defective parts.
What is the mathematical difference between OEE and OLE?
While OEE (Overall Equipment Effectiveness) focuses exclusively on physical assets and machinery performance, OLE (Overall Labor Effectiveness) calculates the operational efficiency and utilization of the human workforce operating those machines. They should be evaluated concurrently.
Do scheduled holidays or planned facility closures lower an OEE score?
No. The baseline denominator of OEE is strictly Planned Production Time. Plant shutdowns, corporate holidays, and scheduled preventive maintenance blocks are subtracted before the calculation begins, preventing artificial penalties to the engineering performance profile.
How does OEE relate to Lean Manufacturing principles?
Lean manufacturing concentrates on identifying and removing waste (muda) from value streams. OEE is the core quantitative instrument of Lean, categorizing hidden operational waste into hard data points that empower engineering teams to deploy targeted root-cause corrective actions.
Conclusion
OEE is one of the most foundational metrics in modern manufacturing because it replaces intuition with empirical operational truths. Rather than simply serving as an engineering score, it provides a rigorous roadmap for unlocking hidden capacity and boosting manufacturing margins.
In an ultra-competitive global landscape, relying on manual data logs is no longer sustainable. The future belongs to manufacturers who bridge the gap between diagnosis and execution, leveraging prescriptive AI and dynamic APS solutions to turn data streams into maximum throughput and permanent profitability.